Tutorial: Your First Experiment
This is the end-to-end walkthrough: install the package, train predators to catch prey, watch them learn, read the learning curves, evaluate the trained policy, and then change one thing and see the effect. By the end you will have run a real MARL experiment and know how to interpret it.
Prerequisites: skim RL Foundations (what Q-learning is) and GridWorld (what the environment is).
1. Install
git clone https://github.com/UHUMALAB/PPAGE.git
cd PPAGE
python -m venv .venv
source .venv/bin/activate        # Windows: .venv\Scripts\Activate.ps1
pip install -e ".[baselines]"
Confirm it worked:
2. Train the default experiment
The IQL config (plug-and-play/configs/experiment_iql.yaml) is 3 predators vs 3 prey learning
with IQL for 1000 episodes. Train it:
You will see periodic log lines as epsilon decays and the agents improve. Training
is tabular and fast. When it finishes, it writes a checkpoint (trained_iql.pkl).
3. Watch the learned behavior
Here is a trained predator (red) closing in on prey (green) around obstacles, one
greedy episode end to end. This is a minimal 1v1 illustration produced offscreen
by .github/scripts/make_docs_media.py (a tabular Q-learning predator chasing a
random-moving prey), so it shows the learning outcome clearly:
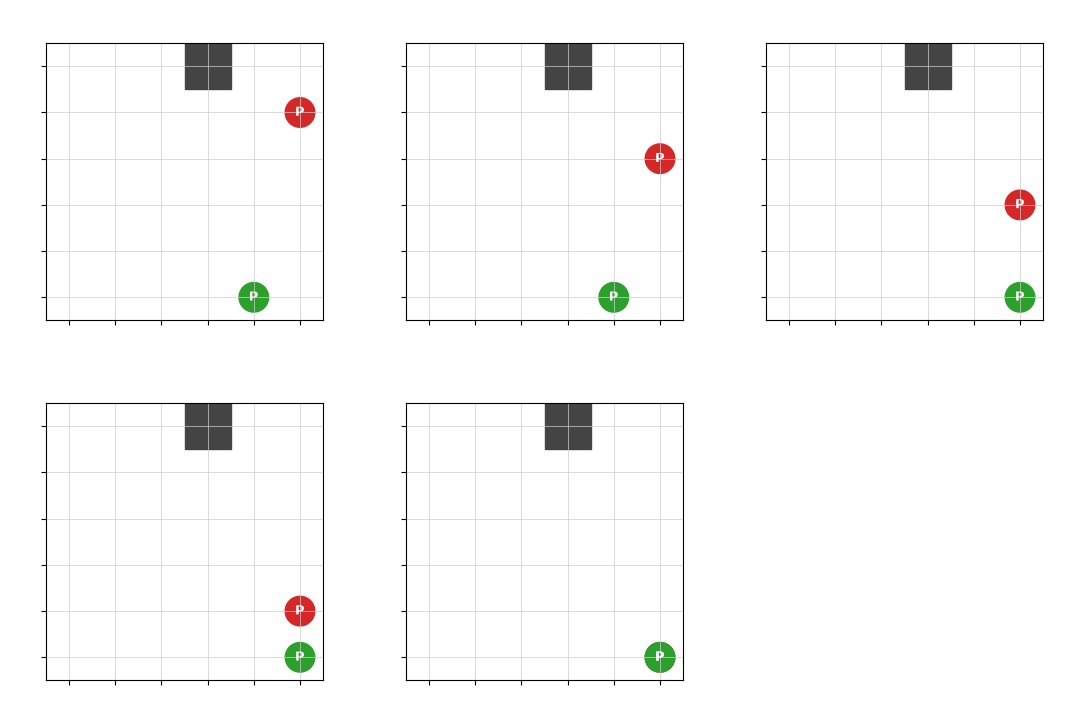
The episode ends the moment a predator lands on the prey's cell (a capture). Early in training the predator wanders; after training it moves purposefully toward the prey. To watch a live episode yourself (opens a window):
4. Read the learning curves
"Is it actually learning?" is answered by two curves: the return the predator earns and the episode length (how many steps until capture). As learning proceeds, return should rise and episode length should fall (captures happen sooner).
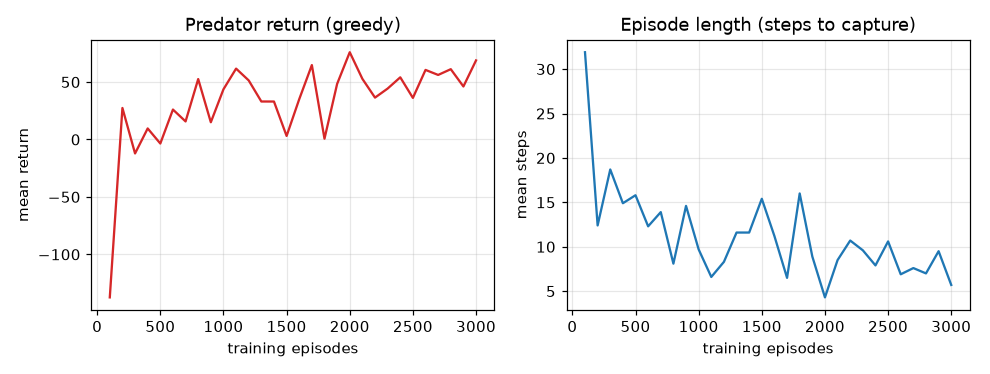
- Return going up → the policy is finding more reward (captures, less step cost).
- Episode length going down → the predator captures faster, the clearest sign of a good pursuit policy.
- A noisy, flat curve usually means too little exploration or too few episodes
— raise
episodesorepsilon/epsilon_decay.
These images are produced by .github/scripts/make_docs_media.py, which trains a small
tabular Q-learning predator (against a random-moving prey) offscreen and captures
both the episode and the curves. Run it yourself to regenerate them:
5. Evaluate
Measure the trained policy greedily (no exploration) and print summary metrics:
This prints the mean episode length and mean per-agent return over several
episodes. (evaluate.py does the same from a config; pass --load-path so it
evaluates a trained model rather than a fresh one.)
6. Change one thing and compare
The whole point of this testbed is controlled, one-variable-at-a-time change. Try any of these and re-run:
- Reward shaping. In
plug-and-play/configs/rewards.yaml, add or remove thepredator_distanceshaping term and compare how fast episodes shorten. See Rewards. - Observation model. In
plug-and-play/configs/observations.yaml, switchtypebetweenlocal_radius(partial view) andabsolute(full view). See Observations. - Algorithm. Swap
name: iqlforcqlormixedin the experiment config. See Algorithms. - Embodiment. Give predators or prey different
speed/staminainplug-and-play/configs/agents.yaml(honored by the SpeedWrapper).
Because runs are fully seeded, the only thing that changed is the variable you touched — that is what makes the comparison meaningful.
Where to go next
- Build a custom observation, reward, or action space.
- Copy-paste ready configs from the Config Recipes.
- Understand the full picture in Architecture.